By Jason Sutich, mynorthwest.com Teamsters Local 174 has filed multiple complaints with the Washington State Department of Labor and Industries (L&I), alleging that Costco has blatantly...
Read More
By Jason Sutich, mynorthwest.com Teamsters Local 174 has filed multiple complaints with the Washington State Department of Labor and Industries (L&I), alleging that Costco has blatantly...
Read More
By Tan Vinh, The Seattle Times Din Tai Fung, the popular soup dumpling chain, has agreed to pay $567,361 in restitution to 1,245 current and former

For the fifth time in federal history, America will celebrate Juneteenth on Thursday, June 19, 2025. The first Juneteenth celebration took place 159 years ago,

Many workers are underpaid or denied benefits without knowing. Don’t leave money on the table — check your L&I benefits. What Are L&I Benefits? If you’ve
Many workers are underpaid or denied benefits without knowing. Don’t leave money on the table — check your L&I benefits. What Are L&I Benefits? If you’ve...
Read More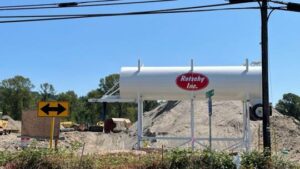
Nick Morgan, nbcrightnow.com The Washington State Department of Labor & Industries says it could take months to properly investigate the Tuesday accident in the 1900 block...
Read More
Isobel Charle, Producer, publicnewsservice.org Workers’ rights advocates are celebrating a new law mandating “good faith and fair dealing” in Washington’s workers’ compensation system. They said the law...
Read More
The Washington State Department of Labor and Industries accepts around 90,000 workers’ compensation claims a year. While you should always report an industrial injury to...
Read More
This year, state Senator Manka Dhingra, a Democrat representing Redmond, introduced Senate Bill 5217. This bill would repeal a current prohibition that prevents Labor and...
Read More
Can You Sue Your Employer In Washington State? It’s hard to know what your options are when you have a work-related injury. Although you can’t...
Read More
By Jason Sutich, mynorthwest.com Teamsters Local 174 has filed multiple complaints with the Washington State Department of Labor and Industries (L&I), alleging that Costco has blatantly...
Read More
By Tan Vinh, The Seattle Times Din Tai Fung, the popular soup dumpling chain, has agreed to pay $567,361 in restitution to 1,245 current and former...
Read More
For the fifth time in federal history, America will celebrate Juneteenth on Thursday, June 19, 2025. The first Juneteenth celebration took place 159 years ago,...
Read More
The News TribuneShae JohnsonUpdated March 6, 2025 The Pierce College District will pay $1.2 million to settle a class-action lawsuit that arose from a cyberattack...
Read More
On February 6, 2025, FinTech customers have motioned to appoint Emery | Reddy Attorney Timothy W. Emery as one of the attorneys who will represent...
Read More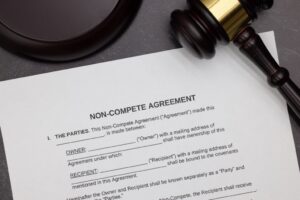
An important order has been issued in the Freedom Vans case, interpreting RCW 49.62.070 in a way that significantly protects low-wage employees. Since 2022, Emery...
Read More
For the fifth time in federal history, America will celebrate Juneteenth on Thursday, June 19, 2025. The first Juneteenth celebration took place 159 years ago,...
Read More
Whether small or serious, workplace accidents happen all the time. In Washington state, you are covered for any injuries you may suffer while on the...
Read More
Safeway Distribution Center in Auburn Fined for Violating New Law Auburn’s Safeway Distribution Center was fined over $11,000 by L&I for quota-related safety and workplace...
Read MoreUna clase propuesta de trabajadores de almacén y venta minorista de Amazon ha acusado a la empresa de obligarlos a firmar cláusulas de no competencia,...
Read More
Nuestra misión de ayudar y empoderar a los trabajadores se extiende más allá de nuestra comunidad y hacia la próxima generación, y estamos orgullosos de...
Read More
¡Síguenos en redes sociales para tener la oportunidad de ganar entradas para los Seahawks! Cómo participar: Síguenos en Instagram, Facebook, LinkedIn, TikTok, and/or YouTube 2....
Read More